The International Union for Conservation of Nature (IUCN) has, since 1948, served as a science-policy interface for biodiversity and ecosystem services. IUCN has a membership of which the governance weight is exactly 50 per cent intergovernmental (with over 200 state and government agency members) and exactly 50 per cent civil society and indigenous peoples’ organizations (over 1,000 civil society members). The Union mobilizes independent commissions to provide expert input into pressing challenges of nature conservation; there are currently six commissions (Ecosystem Management, Education and Communication, Environmental Economic and Social Policy, Species Survival Commission, World Commission on Environmental Law, and World Commission on Protected Areas), comprising over 10,000 specialists in total. The IUCN Red List of Threatened Species, initiated in 1964, remains the most authoritative global inventory of endangered species today (Figure 6.11).
The global decline in biodiversity as illustrated by trends in species remains striking (Dirzo et al. 2014). Many observers have suggested that we are witnessing a new mass extinction event (Ceballos et al. 2015), although there is as yet no scientific consensus. The International Union for the Conservation of Nature’s (IUCN) (Box 6.4) Red List of Threatened Species (http://www.iucnredlist.org/) provides the most comprehensive inventory of the global conservation status of plant, animal and fungi species. The status of vertebrates has been relatively well studied (Rodrigues et al. 2014), but fewer than 1 per cent of described invertebrates (Collen et al. 2012) and only about 5 per cent of vascular plants (Royal Botanical Gardens Kew 2016) have been assessed for extinction risk.
According to IUCN’s latest estimates, cycad species face the greatest risk of extinction with 63 per cent of species in this plant group considered threatened (Figure 6.11). The most threatened group of vertebrates are amphibians (41 per cent). Of the few invertebrate species assessments completed, 42 per cent of terrestrial, 34 per cent of freshwater and 25 per cent of marine species are considered at risk of extinction (Collen et al. 2012). Among well sampled invertebrate groups, reef-forming corals have the highest proportion (33 per cent) of species under threat.
For those groups that have been comprehensively assessed more than once, changes in extinction risk through time have been examined using the IUCN Red List Index. The evidence suggests an increase in risk of extinction for all groups individually and as an aggregate from 1993 to 2017 (Figure 6.12).

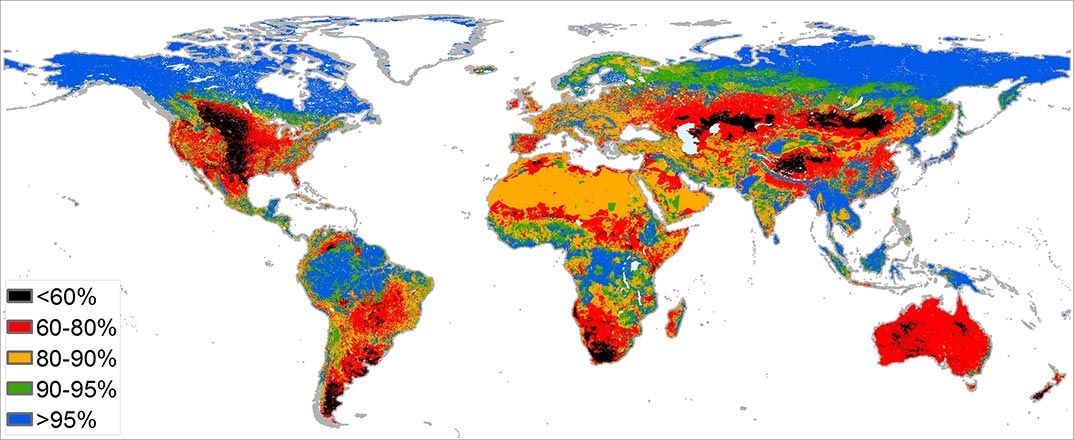
Monitoring the abundance of species provides a complementary indicator of status and trends. Although lacking the comprehensive coverage of many taxonomic groups found in the IUCN Red List Index, these indicators provide finer spatial and temporal resolution. Trends in global vertebrate species population abundances as measured by the Living Planet Index (Figure 6.13) show an average decline of 60 per cent between 1970 and 2014 (McRae, Deinet and Freeman 2017; WWF 2018). Freshwater species have higher rates of population declines than either terrestrial or marine species (McRae, Deinet and Freeman 2017). Globally, average local abundance of terrestrial species is estimated to have fallen to 85 per cent of modelled abundances in the absence of anthropogenic land-use change (Newbold et al. 2016), although the intactness of biodiversity varies spatially (Newbold et al. 2015; Newbold et al. 2016; Figure 6.14), and data on species population trends of both flora and fauna are sparse.
Trends in invertebrates may well echo those observed in vertebrates. A global index sampling populations of 452 invertebrate species revealed an average 45 per cent decline in abundance over 40 years (Dirzo et al. 2014) and recent reports of declines greater than 75 per cent in biomass of flying insects has been found in protected areas in Germany (Hallmann et al. 2017), with similar findings emerging elsewhere in Western Europe (Vogel 2017) and central Europe (Hussain et al. 2017; Hussain et al. 2018). Particularly steep declines were observed in hoverflies, which are important pollinators (Vogel 2017). Declines in pollinator abundance have also been documented elsewhere, for example, bumble bee species in North America (Bartomeus et al. 2013).

The Living Planet Index (Figure 6.13) and the Biodiversity Intactness Index (Figure 6.14) both indicate that terrestrial species abundance has declined as a result of anthropogenic land-use change, and that the trend of population decline in the last 44 years has shown no sign of slowing (McRae, Deinet and Freeman 2017; WWF 2018). It has been suggested from the Biodiversity Intactness Index that a terrestrial planetary boundary has been crossed (based on a reduction of 10 per cent in Biodiversity Intactness); from this, it is inferred that ecosystem function may be impaired (Newbold et al. 2016).